Lightning detection
1641 words Estimated reading time 7 minutes
Lightning discharge
How lightning initially forms is still a matter of debate1. Scientists have studied root causes ranging from atmospheric perturbations (wind, humidity, friction, and atmospheric pressure) to the impact of solar wind and accumulation of charged solar particles. Ice inside a cloud is thought to be a key element in lightning development, and may cause a forcible separation of positive and negative charges within the cloud, thus assisting in the formation of lightning. It was not obvious, that lightning deals with electricity, since the electric current does not flow through the air. This, on June 10th 1752, Benjamin Franklin flies a kite during a thunderstorm and collects a charge in a Leyden jar when the kite is struck by lightning, enabling him to demonstrate the electrical nature of lightning. He also invented the lightning rod, used to protect buildings and ships.

A lightning discharge emits radio frequency energy over a wide range of frequencies. When high currents occur in previously ionized channels during cloud-to-ground flashes, the most powerful emissions occur in the VLF range. VLF (very low frequency) refers to radio frequencies in the range of 3 kHz to 30 kHz. An essential advantage of low frequencies in contrast to higher frequencies is the property that these signals are propagated over thousands of kilometers by reflections from the ionosphere and the ground. In general, a lightning discharge generates several short duration pulses running between a storm cloud and the ground, or between or within storm clouds. The current flow generates an electric field parallel to the current flow, and a corresponding magnetic field perpendicular to the electric field.
Receiving a lightning signal
Waves with a frequency between 3 kHz and 30 kHz have a length between 100 km and 10 km. A suitable antenna for these frequencies is a small loop antenna with size of less than 1/10000 of the wavelength in circumference. Small loops are also called magnetic loops, because they are more sensitive to the magnetic component of the electromagnetic wave, and less sensitive to near electric field noises when properly shielded. If the loop is small with respect to the wavelength, the current around the antenna is nearly completely in phase. Therefore, waves approaching in the plane of the loop will cancel, and waves in the axis perpendicular to the plane of the loop will be strongest. This property changes if the loop becomes larger.
The electric field of the radio waves emitted by cloud-to-ground lightning discharges is mainly oriented vertically, and thus the magnetic field is oriented horizontally. To cover all directions (all- around 360 degree) it is advisable to use more than one loop. A suitable solution can be obtained by two orthogonal crossed loops as they are used for a direction finding system.
The electromagnetic signals of lightning discharges are not waves of a fixed frequency. The signals have more or less the form of an impulse and thus emits waves over a wide range of frequencies. Every of these impulses is unique and looks different. To measure the time of arrival of a lightning discharge, we need a wide-band receiving system, and not a tuned system. The antenna should be large to get a high voltage caused by the change of the electromagnetic field. If the loop consists of more than one winding, the wire placed side by side forms a capacitance.
Resonance
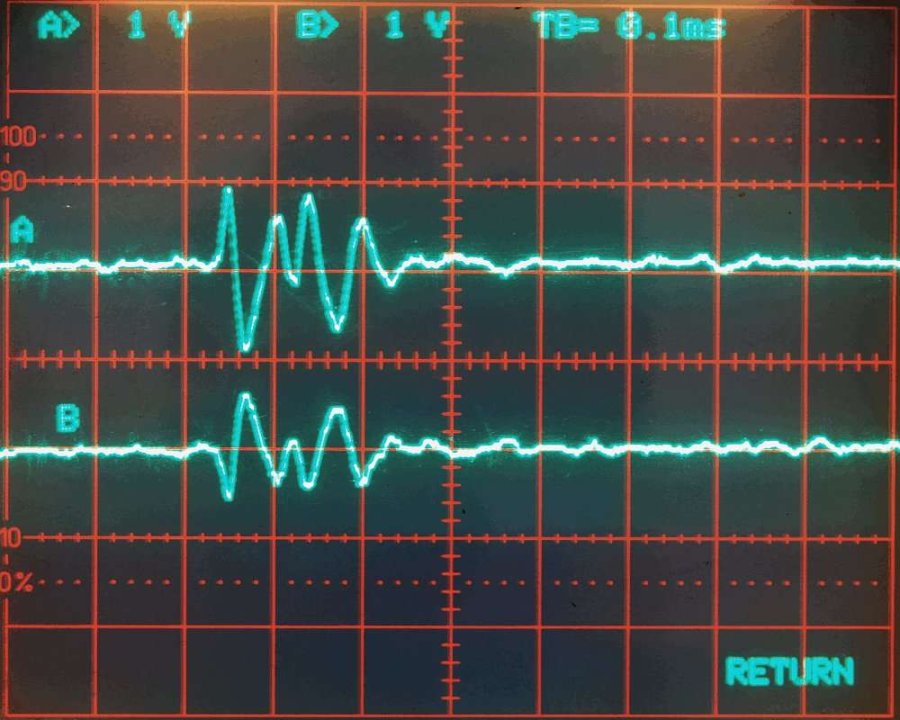
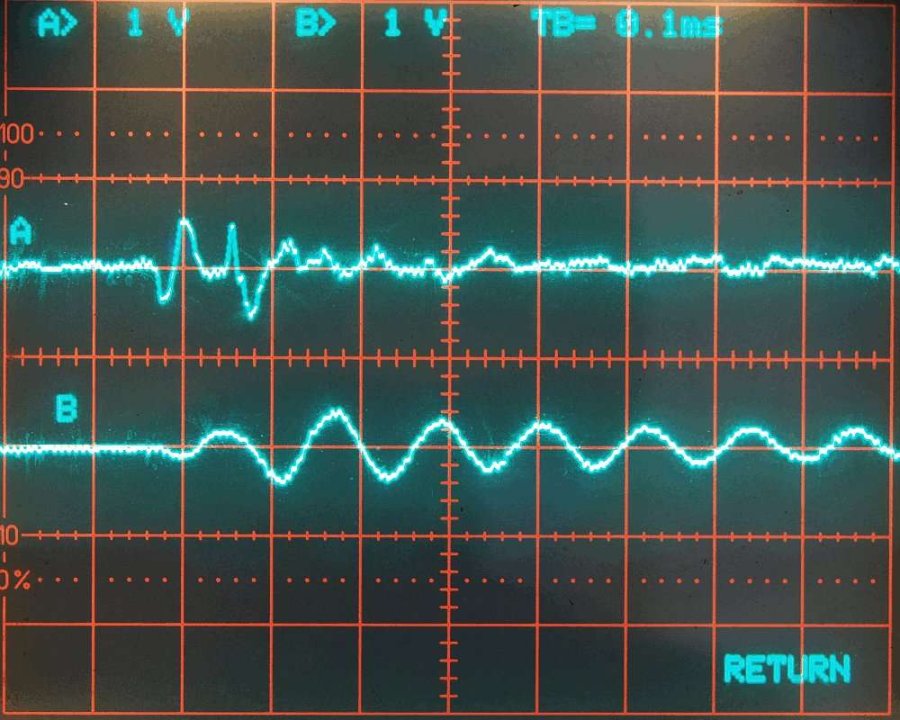
However, the unavoidable own resonance frequency of a loop should be as high as possible such that we can easily suppress these frequencies by a low-pass filter. The image below shows to the left a signal received by two equal sized untuned loops antennas. These loops have no additional tuning capacitor. The resonance frequency of the antenna is approximately at 1000 kHz (= 1 MHz). The used amplifier reduces frequencies of 1000 kHz by -72 dB (=4000 times). In the right image, Loop B is connected to a parallel tuning capacitor of 1 µF. Now, the tuned frequency is the antenna is approximately 10 kHz. Since lightning impulses often contain a lot of energy at 10 kHz, the tuned loop antenna only outputs unusable uniform waves of 10 kHz. This signal cannot be used for time measurement. This shows that it is very important to use a pure loop without any parallel capacitor.
Hint
Please avoid any additional tuning capacitor!
Time-of-Arrival method
The TOA lightning location technique is based on the computations of hyperbolic curves. The emitted radio signal of a lightning discharge is traveling through the air with the speed of light. This is approximately 300000 kilometers per second, or equivalently, 300 meters per microsecond. Each received signal gets a time stamp.

Let \(tA(s)\) be the time stamp for signal \(s\) from station \(A\). Time stamp \(tA(s)\) is the Coordinated Universal Time (abbreviated UTC) in microseconds with an accuracy of \(±1µs\). The difference of two time stamps for the same signal received by two different stations and the positions of these two stations define a hyperbolic curve. Let \(dA(p)\) be the distance of a point \(p\) to station \(A\) in meters. Then the hyperbolic curve for signal \(s\), is the set of all positions p whose distance difference \(dA(p) − dB(p)\) in meter corresponds to the time stamp difference \(tA(s) − tB(s)\) in microseconds converted by the speed of light into meter. That is,
The source of the signal has to be somewhere on this hyperbolic curve. The intersection point of three or more such hyperbolic curves defines the unique location of the source of the radio signal. The computed position is then be assumed to be the location of the lightning discharge. At least 4 sites not on a line are needed to define always a unique intersection point. With more than four receiving stations reporting a time stamp for the same signal there is some redundant information available to improve the accuracy and to verify the performance.
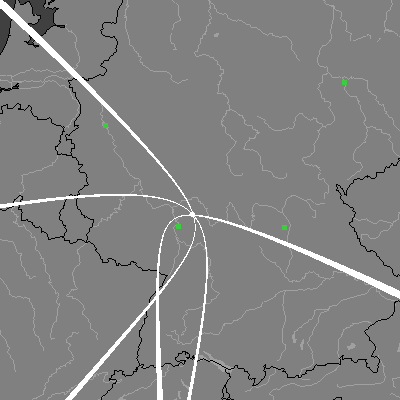
Three hyperbolic curves defined by the three time differences \(tB(s) − tA(s), tC(s) − tA(s)\), and \(tD(s) − tA(s)\) of four sites \(A\), \(B\), \(C\), and \(D\) (the green squares). The intersection of all three curves uniquely defines the location of the source of the radio signal (the white dot). The curves have a width corresponding to a tolerance of \(±5µs\). That is, the white area for signal \(s\) received by station \(A\) and \(B\) is the set of all points \(p\) for which
A time difference of \(±100µs\) corresponds to a distance difference of ±30 kilometers. That is, if site A receives the same signal \(100µs\) earlier than site B, the corresponding hyperbolic curve is defined by the set of all points that are 30 kilometers near to site A than to site B. Assume the time stamps have an accuracy of ±1µs and there are four sites arranged such that their positions define a square. If the signal source is exactly in the middle of the square, then the deviation of the computed position to the real source of the signal is greater than \(±300m * √2 = 424m\). It can be much greater if the source of the signal is outside the square. The picture below show the deviations for an accuracy of \(±1µs\) for different cut angles.

The main challenge of a TOA lightning location system is to assign the received signal a unique characteristic time stamp. This is not easy, because the outline of the signal changes when it travels over long distances. One way to handle different signal forms, is to compute a time of group arrival, see 1. However, if the time stamps are not consistently assigned, the hyperbolic curves do not intersect in a common intersection point. A collection of several nice papers about lightning detection can be found in 2.
The computations at our server are carried out in two steps. In the first step a starting point is computed using the method from 3 applied to the first 4 time stamps. After that a numerical method is used to minimize the sum of all squared distances to the hyperbolic curves. All our computations use spherical coordinates.
Accuracy
Note
Improvement of accuracy is on the to do list.
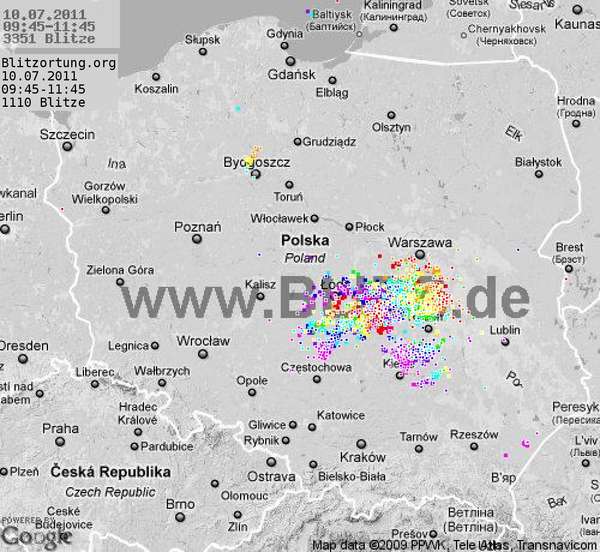
The following pictures show a comparison of the positions computed by Blitzortung.org and "BLIDS" over Germany, Belgium, and Poland. BLIDS is a commercial lightning information system in Germany operated by SIEMENS.


Direction finding method
Direction finding is a very simple method of estimating the source direction of a electromagnetic signal. The signal strength of magnetic antennas depends on the direction of the signal. Two magnetic antennas arranged at right angles can therefore be used to determine the direction of origin of the signal. The signal strength can also be used to estimate the distance. This method is very imprecise and is not used by us.
-
H.D. Betz, U. Schumann, and P. Laroche (Eds.) Lightning: Principles, Instruments and Applications. Springer Verlag, 2009. ↩↩
-
R.L. Dowden and J.B. Brundell and C.J. Rodger. VLF lightning location by time of group arrival (TOGA) at multiple sites. Journal of Atmospheric and Solar-Terrestrial Physics, 64(7):817-830, 2002. ↩
-
W.J. Koshak and R.J. Solakiewicz. TOA Lightning Location Retrieval on Spherical and Oblate Spheroidal Earth Geometries. Journal of Atmospheric and Oceanic Technology, 18(2):187-199, 2001. ↩